AAPA has partnered with Trade Currents to improve our collection and reporting of critical port trade data that will not only support the needs of our members, but also benefit the broader trade and logistics industry, research community, and private institutions. The founding partners of Trade Currents include internationally recognized economists and trade analysts Dr. Walter Kemmsies, Andrei Roudoi and Scudder Smith. The following article is a first of a series for which Trade Currents will analyze the data that has been collected from various public sources and port members.
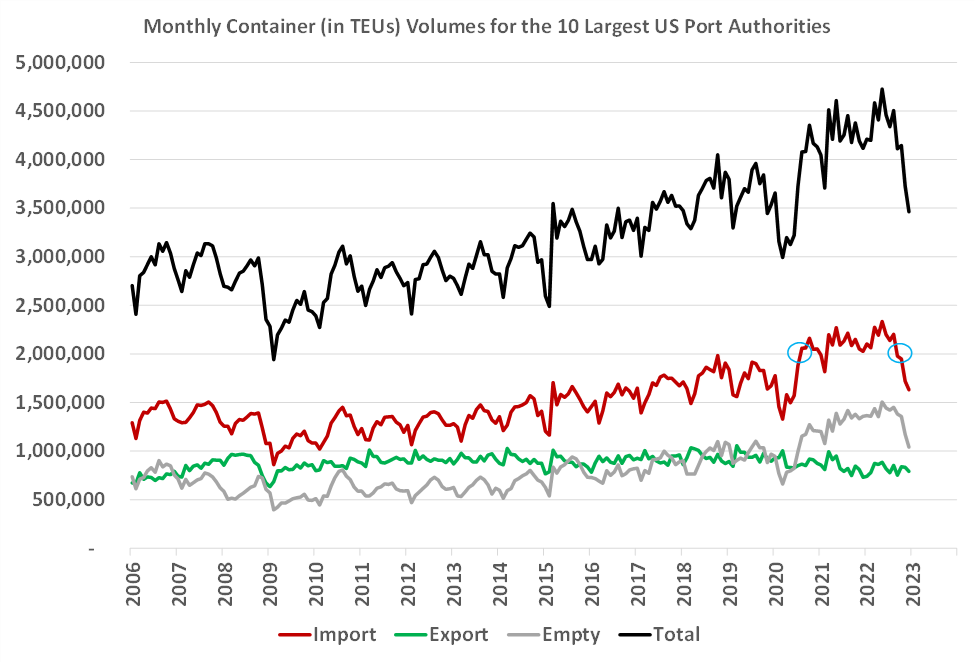
A global pandemic has to be near the top of the list of the most disruptive events that have affected shipping patterns, with every country and all segments of their economies being impacted. It is not surprising that freight movement, and container shipping in particular, has been struggling. This is quite visible in the chart below showing international container volume flows at the 10 largest container ports in the U.S. In August 2020, import volumes handled by these ports exceeded 2 million TEUs for the first time, and, except for February 2021, stayed at those peak levels for 25 months until August 2022.

Source: AAPA, Port websites, Trade Currents
Based on data provided to AAPA, every month was peak season for two solid years. The only other time these ports handled over 2 million TEUs was November of 2018 when the previous administration announced tariffs on imported products from China starting in 2019. The focus here is on containerized imports since they are the main source of volatility for the past three years.
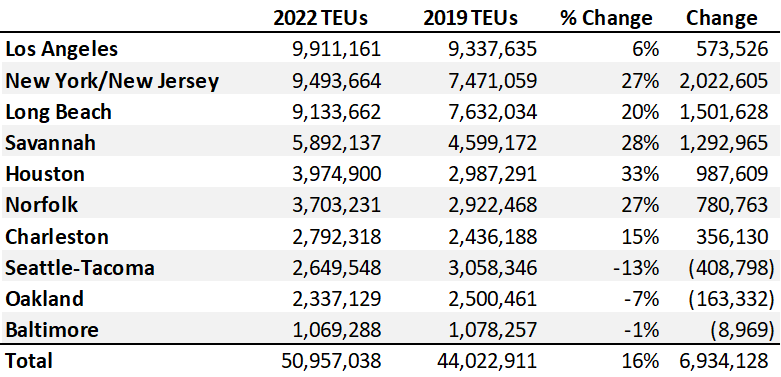
The impacts of the virtual siege on ports from August 2020 to August 2022 varied. The table below compares the calendar year 2022 volumes with pre-pandemic 2019 volumes for the 10 top container ports in the United States. Six ports have had double digit percentage increases and three have lower volumes.

Source: AAPA, Port websites, Trade Currents
There are several reasons for the variation in volume changes. An important factor is that during the two years of constant peak-level volumes, ocean carriers and beneficial cargo owners (BCOs) made large changes to their operations. BCOs reacted to congestion at West Coast ports and rerouted freight to the East and Gulf Coasts. Steamship lines added new services from Asia to the East and Gulf Coasts. Some of the liners whose ships had to wait up to several weeks to get to a berth, decided to drop off all of their cargo at the port and head back to Asia, voiding other port calls in North America.
Many things changed when the U.S. shut down in the second quarter of 2020. A lot more activity was conducted at home, and spending on household supplies surged. It was necessary to buy furniture so that adults could work from home and children could attend school from home. The Federal Government handed out several trillion dollars to households, which fed the spending frenzy. Lifestyles and spending patterns changed in response to the need to do a lot more from home.
Much of the change that happened before COVID-19 vaccines became available started to reverse soon after. This was evident in the Transportation Safety Administration data on the number of airline passengers processed each day. Many predictions and forecasts made at the height of the shutdown turned out to be incorrect. Consumers shifted back to spending more on services and less on goods in proportions similar to those of pre-pandemic years.
Some things have likely changed permanently:
These factors underlie the change in market shares among the different U.S. coasts, based on the ten largest container ports, shown in the table below.

Source: AAPA, Port websites, Trade Currents
These coastal shifts may represent long lasting changes brought about by the global COVID-19 pandemic. However, it is likely that some of the volumes that have shifted between coasts for temporary reasons such as labor issues are likely to return to previous patterns when such matters are resolved.
In their next AAPA article, Trade Currents will discuss the various factors that impact and complicate the outlook for containerized imports. If you have any questions, please contact Shannon McLeod, Senior Director of Member Services.