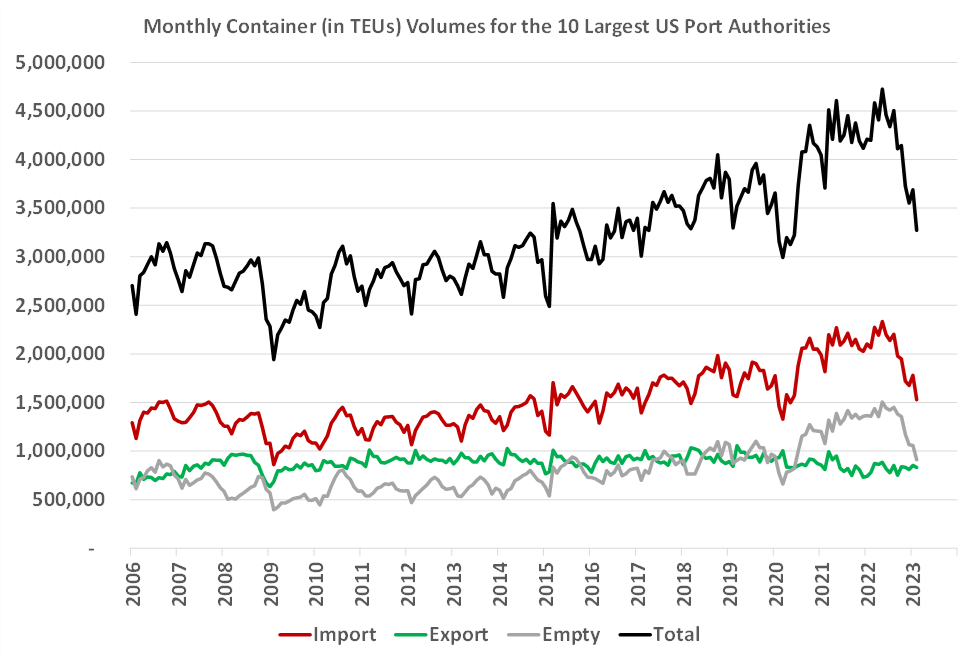
AAPA data shows that total containers handled at the 10 largest U.S. ports by volume have declined 31 percent from the recent peak in May 2022 through February 2023. This is a result of a decline of imports by 35 percent, followed by decline in empty containers by 40 percent. Imports represent approximately 50 percent of the total containers handled by U.S. ports.
Consensus expectations call for continued large year-on-year and month-on-month declines in imported container volumes for the next several months, with a turnaround in the second half of the year. However, some macro trends indicate that this might not happen. This is the focus of this quarterly update.

Source: AAPA, port websites, Trade Currents
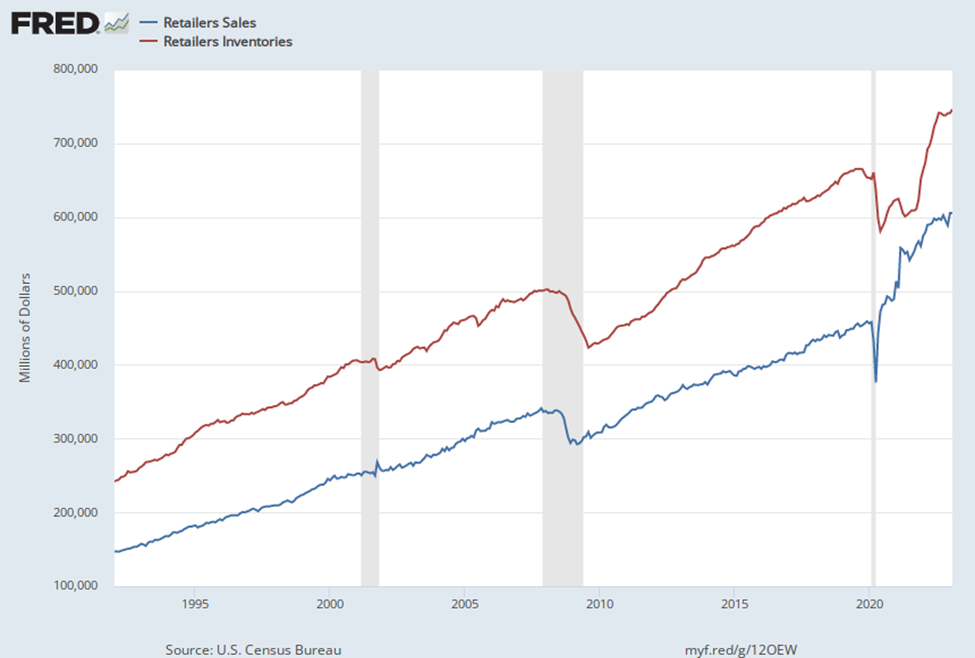
There are two important categories of imported containerized goods to consider: general merchandise sold by U.S. retailers and durable household goods. Trade Currents estimates that these goods account for over half of the imports flowing through the nation’s largest container ports. The charts below show the trends for each of these types of goods.
The first chart shows that retailers’ sales fell sharply when the U.S. economy shut down in the first half of 2020 but bounced back just as sharply by the middle of the year. This resulted in a sharp drop in inventories and Retailers struggled until January 2021 to get them back to the levels of March 2020. However, sales kept surging and only started flattening out in May 2022. However, the aggregate data doesn’t tell the whole story.

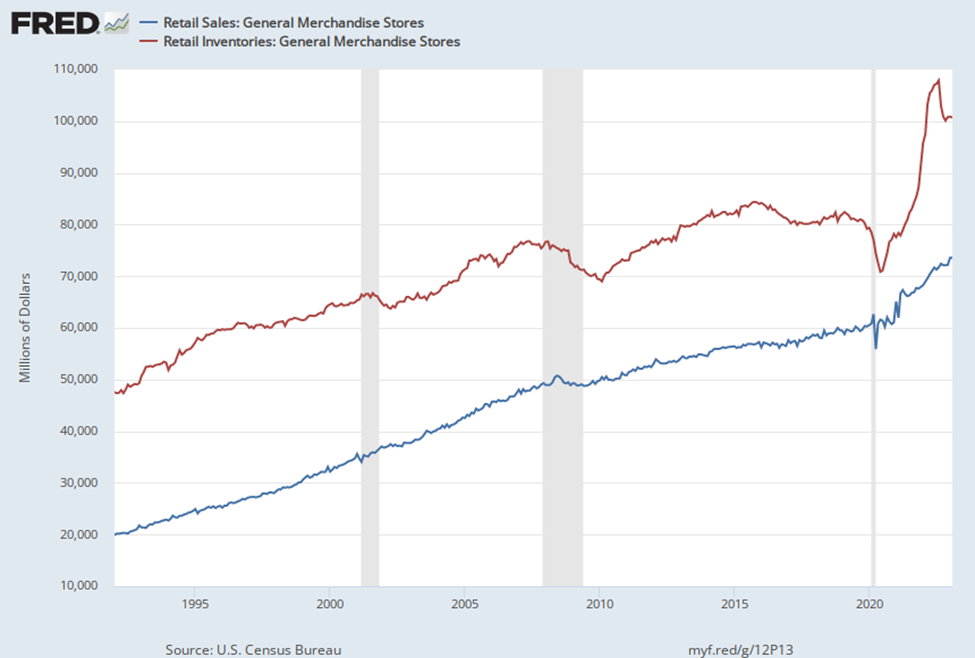
The chart below shows inventory levels for the general merchandise stores segment of retailers. These are large department stores and e-commerce retailers that carry a wide range of goods. These companies could afford to buy additional space on container vessels and were able to rebuild their inventories faster than the smaller retailers. Their inventories surged well above trend levels while their sales only slightly increased. The over-stocked general merchandise store segment is currently unlikely to be placing purchase orders with Asian suppliers given how high their inventories are.

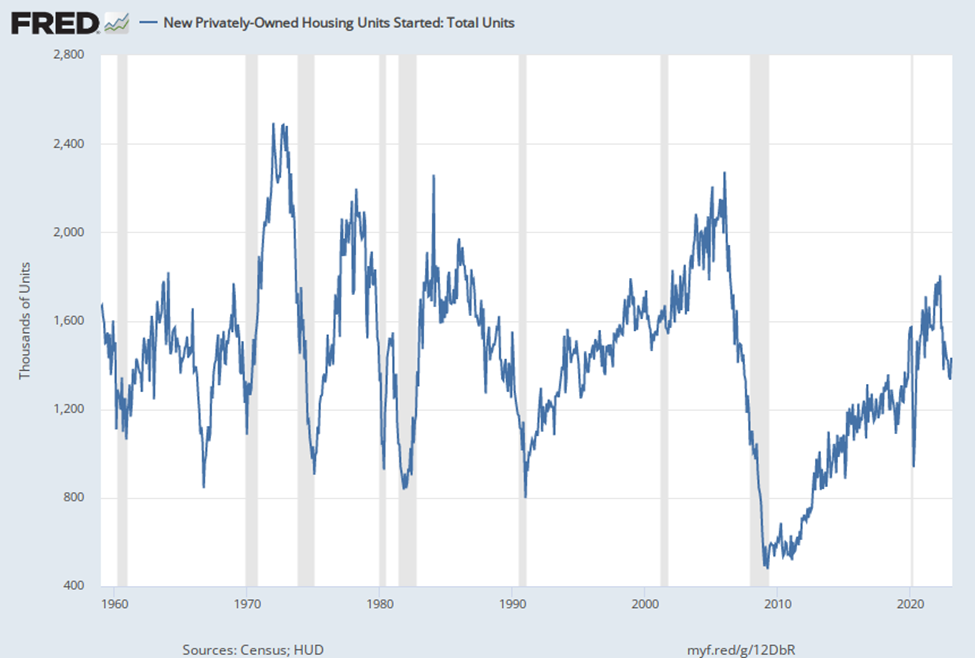
The other large source of containerized import demand comes from the real estate sector. While there are many subsectors in the real estate industry, our focus is on construction of new privately-owned housing units shown in the chart below. During the time period shown (1959 – 2023), the average number of new starts was 1.433 million per year.

Since the residential real estate market crash in 2009, the U.S. spent over a decade with new housing starts below the long term average of 1.43 million new starts per year. This implies that there is now a shortage of housing units in the U.S. Freddie Mac recently announced that the U.S. was more than four million units short of demand. Recent Federal Reserve interest rate increases have helped reduce construction of new housing that would have reduced inflation due to natural long-term demand for housing.
Residential real estate construction generates significant demand for imported goods, such as appliances, furniture, tiling, floor covers, furniture, and more. It should be noted that imported goods are mostly used to build homes in America.
The Federal Reserve has been raising interest rates since 2022 because it believes that the increase in inflation is due to strong demand that can only be halted by dampening demand for goods, including household durable goods. Although it is clear to members of the supply chain industry that the main sources of inflation are from supply side disruptions, the Federal Reserve continues to take actions to quell “excess” demand that impacts the outlook for imported containerized goods.
With these trends in place, U.S. containerized imports are not likely to increase in the second half of 2023. If inventories can be reduced faster than they have been during the first quarter of the year and the residential real estate market continues to recover, then perhaps the second half of 2023 will be better than the first half. Much depends on the outcome of the federal government’s budget negotiations and whether the Federal Reserve continues to tighten aggressively. Unsuccessful budget negotiations and the continuation of monetary policy tightening, especially if combined, have the potential to put the U.S. economy in a recession. Barring that, the earliest we could expect positive year-on-year growth would be August and the latest would be in first quarter-2024.
AAPA has partnered with Trade Currents to improve our collection and reporting of critical port trade data that will not only support the needs of our members, but also benefit the broader trade and logistics industry, research community, and private institutions. The founding partners of Trade Currents include internationally recognized economists and trade analysts Dr. Walter Kemmsies, Andrei Roudoi and Scudder Smith. If you have any questions about this article or AAPA’s work with Trade Currents, please contact Shannon McLeod, Senior Director of Member Services.