| Monday, September 19, 2011 | Archives | Advertise | Online Buyer's Guide | FLEETSolutions |
Lower Volumes, Steady Pricing For Commercial Fleets In Wholesale Market
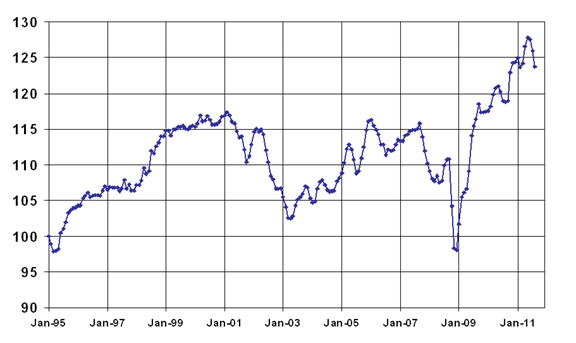
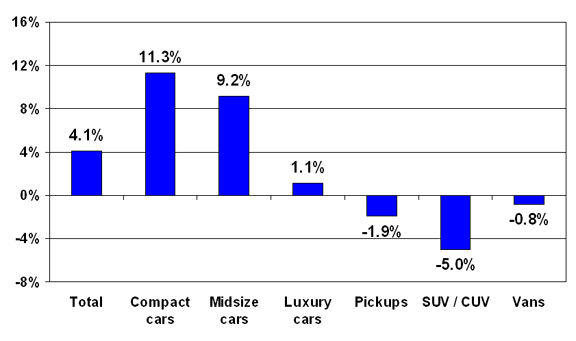
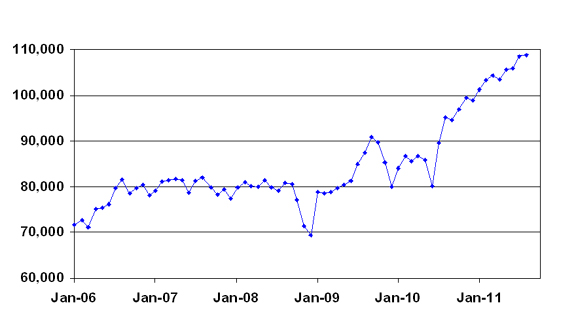
 Prices for Fleet Vehicles Continue Retreat from Record High After reaching a record high in June, mileage- and seasonally adjusted prices for end-of-service mid-size fleet cars eased back in July and August. Full-size pickups coming out of commercial fleet use continued to command record-high prices in August. A review of monthly pricing and volumes sold in 2011 suggests that fleet managers were spot-on in remarketing their largest volumes in the spring, when prices were the highest. In the auction marketplace as a whole, compact and mid-size cars are the only two segments with meaningful gains over the past year; but as with commercial fleet vehicles, it is pickup trucks that have shown the best performance over the past two months. Although compact and subcompact vehicles continue to have tight supplies in the new vehicle market, that situation is expected to change in the months ahead. And, as such, there should be some moderation in pricing.  Higher Mileage Impacts Vehicle Values One interesting factor for fleet managers to consider when measuring their performance in the wholesale marketplace is illustrated by an apparent contradiction in the way values are measured -- average auction prices as reported by AuctionNet showed a year-over-year decline of 1.1 percent in July, but the Manheim Index had a year-over-year increase of 5.9 percent. How is this possible? The main reason for the difference is that the Manheim Index takes mileage into consideration. And, over the past year, the average mileage on vehicles sold at auction has risen significantly. (Adjustments for changes in the mix of vehicles sold have been relatively modest recently.) Presented here is the average mileage from January 2006 to July 2011 for full-size SUVs. Although this segment has had the biggest increases in mileage, every market class of vehicle has experienced significant rises in average mileage.  The higher mileage is a reflection of the new vehicle sales cycle, the shift from commercial to dealer consignment, and shifts between the types of commercial consignment. So, when you read that the average price of a full-size SUV has fallen by more than sixteen percent over the past year, recognize that the commentator may be comparing an 80,000-mile vehicle to one with 110,000 miles. That’s not fair.  Tom Webb is chief economist for Manheim Consulting. Contact him at Thomas.webb@manheim.com, follow him via Twitter at www.twitter.com/TomWebb_Manheim and read his blog at www.manheimconsulting.typepad.com. Tom Webb is chief economist for Manheim Consulting. Contact him at Thomas.webb@manheim.com, follow him via Twitter at www.twitter.com/TomWebb_Manheim and read his blog at www.manheimconsulting.typepad.com. |
 |
NAFA Fleet Management Association 125 Village Blvd., Suite 200 Princeton, NJ 08540 Telephone: 609.720.0882 Fax: 609.452.8004 |


