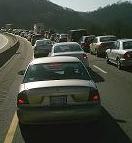
Traffic Congestion In U.S. Drops Thirty Percent Fueled By Lackluster Employment And High Gas Prices
 Inrix, a global traffic research firm, recently released its fifth annual National Traffic Scorecard report revealing traffic congestion decreased thirty percent from 2010 to 2011. Drawing on five years of trend data, the 2011 Annual Report documents that traffic congestion dropped thirty percent last year compared to 2010. The last time America experienced such a significant drop in traffic congestion was 2008 when traffic congestion plummeted thirty percent as the country fell into the worst economic recession since the Great Depression.
With only moderate increases in employment in 2011 (+1.5 percent), the data indicates the country may be experiencing the jobless recovery economists warned of during the recession. As forecasted in last year’s report, rising fuel prices combined with lackluster employment gains and modest increases in capacity resulting from completed stimulus projects and less spending on road construction nationwide has resulted in less gridlock on the nation’s road networks.
In summary, the data paints a picture of a "Stop N’ Go economy" where shifts in traffic congestion are indicative of shifts in the broader economic health of our cities. While corporate revenues and profits are up, individuals are experiencing the frustration of a jobless recovery where lack of hiring combined with volatile fuel prices are keeping consumers out of work and off the roads.
Key Scorecard Findings:
- The Nation’s Inrix Index (II), a key indicator of traffic congestion, was 7.1 in 2011, down thirty percent from 2010 (9.7) meaning that the average trip in the nation’s Top 100 Most Populated Cities took six percent longer than if there was no traffic.
- In 2011, only thirty metropolitan areas saw increased congestion vs. 2010. With the remaining seventy metros experiencing declines or no change in traffic, the picture of traffic congestion is the exact opposite of 2010 where seventy regions saw increases in congestion compared to the prior year.
- All congestion is not created equal: The nation’s worst travel corridors can cost their drivers more than sixty hours of annual delay in the evening peak period alone. Over 1,400 miles of our nation’s main corridors were congested last year, down from 2,300 miles in 2010.
- When examined with employment and fuel price data from 2011, the Scorecard shows how observed shifts in traffic congestion serve as a key indicator of economic health.
Despite mostly positive news on Wall Street, the Scorecard paints a much different picture on Main Street. The Scorecard found the nation’s Inrix Index for 2011 dropped thirty percent from 9.7 to 7.1 – nearly the same dramatic drop in traffic as 2008. Is this indicative of the start of a double dip recession or just the result of a jobless recovery hitting the commuter class? Are higher fuel prices impacting driver behavior in a Stop N’ Go economy?
Research shows year-to-year changes in several key statistics, each based on data from the appropriate federal agency. Also, comparisons are made in each between 2011 and 2007, the peak year in all statistics, including the highest level of congestion recorded to date. Combined with shifts in traffic congestion highlighted in this report, the data tells as much about mobility as it does about our broader economy.
Despite the decline, drivers still idle in gridlock more than forty hours a year in America’s worst-traffic cities, wasting over sixty hours annually on our nation’s most traffic-clogged roads.
To view the complete Traffic Scorecard report, visit http://scorecard.inrix.com/scorecard/default.asp
 Inrix, a global traffic research firm, recently released its fifth annual National Traffic Scorecard report revealing traffic congestion decreased thirty percent from 2010 to 2011. Drawing on five years of trend data, the 2011 Annual Report documents that traffic congestion dropped thirty percent last year compared to 2010. The last time America experienced such a significant drop in traffic congestion was 2008 when traffic congestion plummeted thirty percent as the country fell into the worst economic recession since the Great Depression.