
Understanding Capacity Costs
By Ben Walker, Director of Energy Market Analytics, Hospital Energy and Steven Jalowiec, PE, CHFM, SASHE Vice President Engineering Services Hospital Energy
Introduction
Hospitals in New England are subject to an electricity supply charge called capacity. This line-item comprises approximately 20% of total energy supply spend, though this can vary by location, by year, and by your facility’s load pattern. An auction establishes the rates for capacity years into the future and is conducted annually by the interstate grid operator in New England, ISO-NE. The charge is billed through the 3rd party supplier, but this charge will not be transparent on many fixed rates contracts. The most important thing to understand is that hospitals can reduce these charges through various programs which result in lower usage particularly during a few peak hours in the summer. Your trusted energy advisor can help you identify the cost impact to the hospital and various methods available to reduce these cost.
Results for Recent 2024-2025 ISO-NE Capacity Auction
 |
|
| Used with permission of ISO New England |
In February, ISO-NE released the results of their 15th Forward Capacity Auction (FCA). This auction covers the 12 months from June, 2024 to May, 2025. The results were mixed – certainly lower than current billing periods, which is good news for electricity users. But prices were higher than they were in the most recent auction that was held last year.
Regional Capacity Price Variation
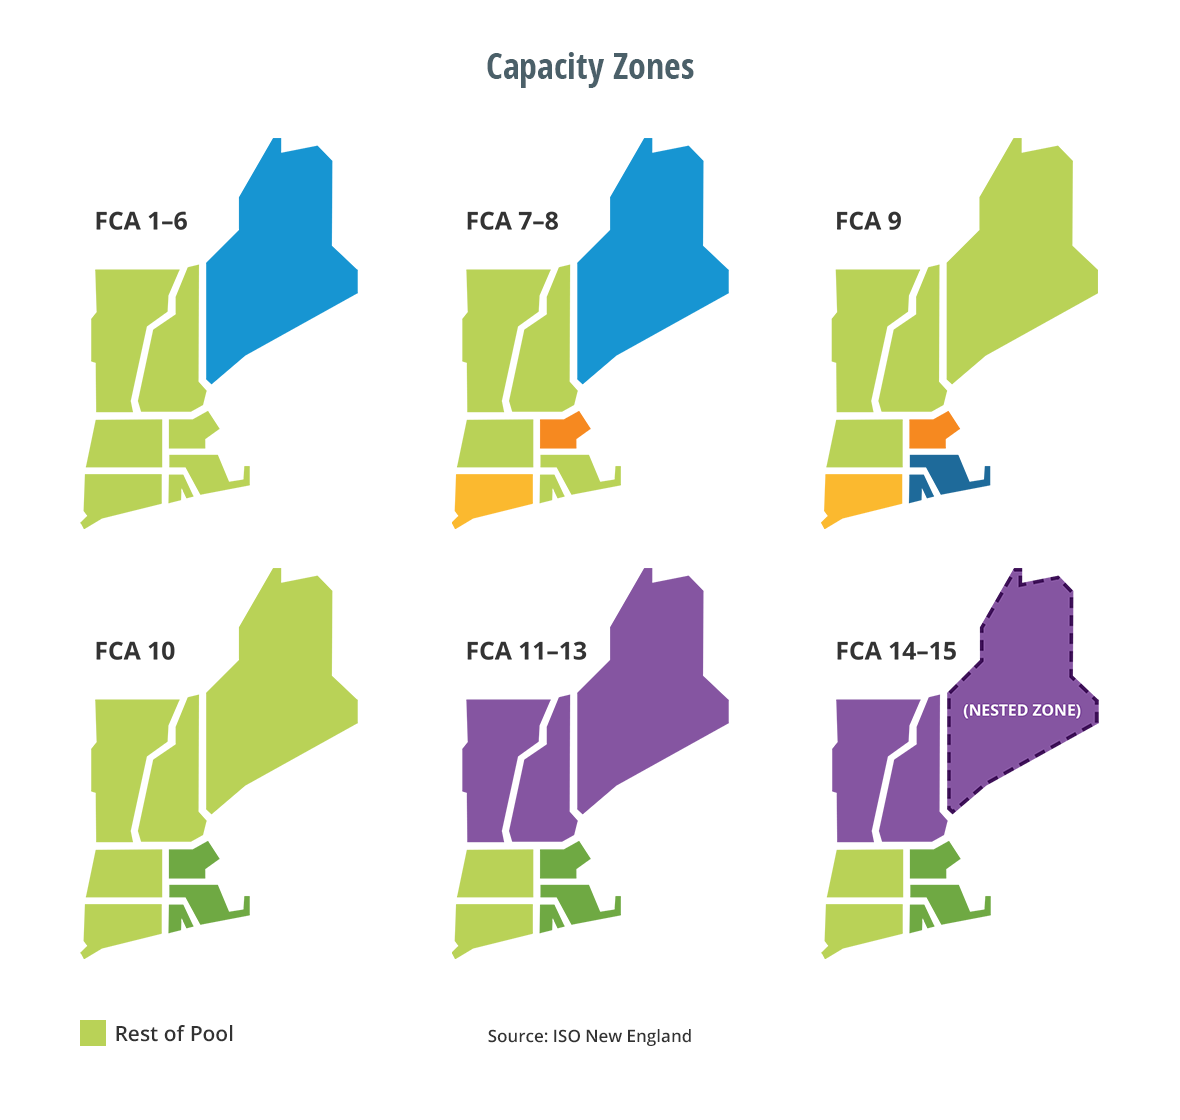
The ISO is divided into various load zones (see figure). The capacity auction can clear different prices for different zones. (Imports, not shown, can also clear separately.) For FCA 7, 8, and 9, the NEMA, SEMA, and RI zones often cleared higher than the Rest of Pool. But for FCAs 10-14, the zones had all cleared at the same prices. In this most recent auction, NEMA, SEMA, and RI again cleared higher than some of their neighboring zones.
Interpreting the Auction Results
Capacity is a demand charge, not an energy charge. Thus, it is based on your peak kW usage, not your kWh usage. (Although it is often billed based on kWh, which can cause some confusion.) Auctions prices are presented in units of $/kW-Mo. A capacity price of $5.75/kW-Mo is roughly equal to an annual expense of $100,000 per MW. Thus, a facility that had a peak of 2.5 MW in the summer and was under an auction price of $5.75/kW-Mo could expect to pay roughly $250,000 for the year. Currently, rates across ISO-NE are $5.30/kW-Mo. The auction that just closed saw prices around $2.50-$4/kW-Mo. These are higher than the $2.00/kW-Mo we saw in the most recent auction. Here is a summary of the current and past auction results:
| FCA | Years Covered | Auction Date | Price ($/kW-Mo) | Est. Annual Costs per 1 MW |
| 10 | 2019-2020 | Feb '16 | $7.03 | $122,000 |
| 11 | 2020-2021 | Feb '17 | $5.30 | $92,000 |
| 12 | 2021-2022 | Feb '18 | $4.63 | $81,000 |
| 13 | 2022-2023 | Feb '19 | $3.80 | $66,000 |
| 14 | 2023-2024 | Feb '20 | $2.00 | $35,000 |
| 15 | 2024-2025 | Feb '21 |
NEMA, SEMA, RI: $3.980 |
NEMA, SEMA, RI: $69,000 CT, WCMA: $45,000 ME, NH, VT: $43,000 |
How Are Capacity Costs Calculated?
Your annual capacity costs depend on the auction price, the usage of your facility (called your tag), and the “reserve margin,” which varies according to summer weather conditions. (A more detailed explanation of the calculation is below.) Only some of these cost inputs are known ahead of time and controllable by your facility (see table). Opportunities to reduce your capacity tag vary from Demand Response, which targets a few hours, to general efficiency efforts that either shift your peak or drive it down during all hours. Energy advisors can help identify which is the best approach for your facility.
Annual Capacity Cost Formula
Annual Capacity Costs = 12 Months * Cap Tag * Auction Price * Reserve Margin
- 12 Months helps convert to annual costs because FCA price units are $/kW-Mo
- Cap Tag is your usage during the one-hour when the grid peaks (not when your usage peaks). This is typically in the late afternoon of a hot, summer workday.
- Auction Price is initially set three years in advance, then can be influenced slightly by subsequent auctions up until flow date.
- Reserve Margin is a fudge factor that is updated after the fact. Conceptually, it corrects for weather. It is unitless and has varied from about 1.2 to 1.5 in the last decade.
Auction Variations
 |
| Used with permission of ISO New England |
The rules and zones change each FCA. The ISO may tweak which resources are allowed to participate, as well as how zones are combined (see figure). They may also change how much capacity they need to procure, as well as how the auction is run. This creates multiple layers of uncertainty in our ability to predict what next year’s auction prices will be. It is wise to monitor price changes as they occur, as projects which help lower your tag may take a year to develop and install and another year or two before they begin impacting your energy spend.
Importance of Projecting Costs Accurately
It can be easy to overlook known future capacity rates when considering any on-campus improvements. All too frequently, analyses for on-campus projects – including efficiency, self-generation, and demand response – look at the last 12 months of rates and assume the future rates will continue to be the same. In order to accurately execute any cost-benefit analysis, these known, future capacity rates must be appropriately included! What would have saved you money in 2018 may cost you money in 2023. Past rates are done and gone – future rates are known, up to the auction’s time horizon, and should be presented correctly when a project is being considered.
Authors
| Ben Walker Director of Energy Market Analytics Hospital Energy bwalker@hospitalenergy.com 408-348-4264 www.hospitalenergy.com |
Steven Jalowiec, PE, CHFM, SASHE Vice President Engineering Services Hospital Energy sjalowiec@hospitalenergy.com203-228-3480 www.hospitalenergy.com |
![]()
![]()
![]()
