DAT Weekly Trendlines Report - Week Ending May 5, 2018
| Dry Vans Start May with a Jump in Rates |
|
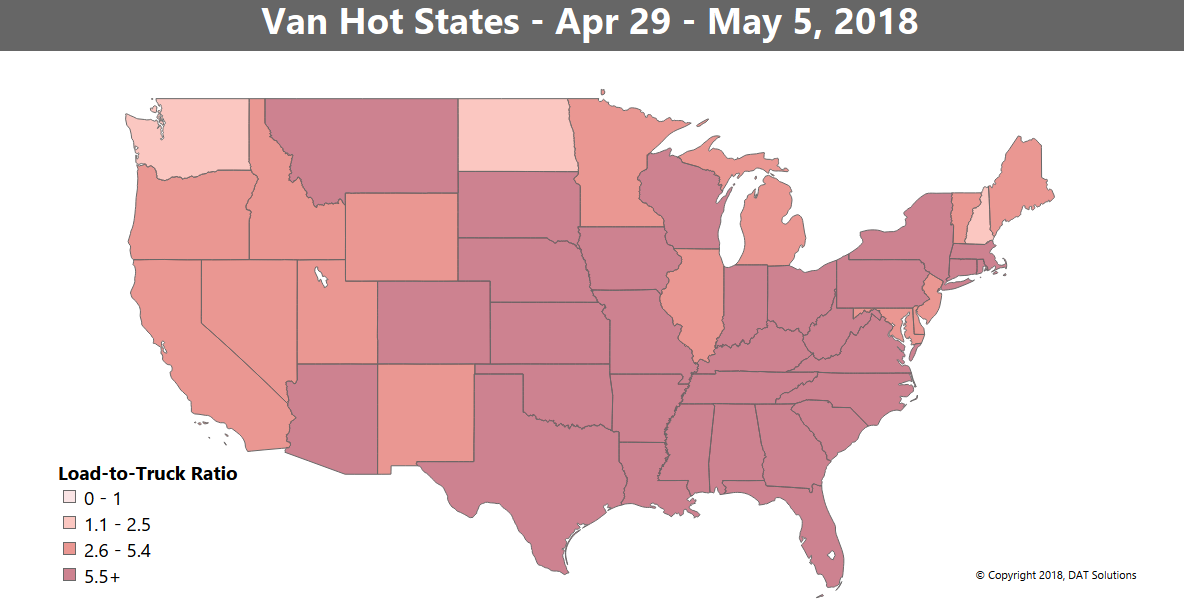
Spot market van freight got a jump start in the first week of May, as volume increased and the national average rate rose two cents to $2.18 per mile. The national average spot rate is now 48 cents higher than it was last year at this time. Rates got the biggest boost in a number of lanes that are associated with retail, including major routes out of Columbus, OH, Buffalo, NY, and Philadelphia, PA. The number-one market for outbound spot freight is now Los Angeles, narrowly displacing Dallas. Note that contract rates have been rising faster than spot rates in recent months, which may begin to restore the historical balance between contract and spot rates, even as prices continue to rise. Shipper-to-carrier contract rates were 10 cents higher than spot market rates last week. That gap widened from 5 cents per mile in April and 3 cents in March. Spot market rates, which are paid by the broker to the carrier, exceeded contract rates for vans in January. Dry van capacity tightened in the first week of May, and the national average load-to-truck ratio edged up to 6.2, due to an increase in demand throughout much of the U.S. The Hot States Map shows a deep red swath indicating ratios above 5.5 loads per truck. The region of highest demand stretched from the Midwest down to the South Central regions, and included most of the East Coast. |
 |
|
The map depicts the outbound load-to-truck ratio for each of the 48 contiguous states in the week ending May 5. The load-to-truck ratio represents the number of loads posted for every truck posted on DAT load boards. The ratio is a sensitive, real-time indicator of the balance between demand and capacity. Changes in the ratio often signal impending changes in freight rates. For more details on spot market capacity and rates, visit DAT.com/Trendlines |