DAT Weekly Trendlines Report – Spot Van Freight Rates Fall as Volume Rises
| Week Ending May 11, 2019 |
Just when we thought spring had finally arrived, van rates cooled off again last week on the spot market. More loads moved than in any other week this year, but there are still plenty of trucks available, so load-to-truck ratios declined despite the additional volume. Van rates backed down to a national average of $1.80 per mile, matching April’s level, despite a one cent increase in the average fuel surcharge.
This trend was also apparent in April’s trend data: 2.4 percent more van loads moved last month compared to April 2018, but at a lower rate per mile.
 |
|
Spot freight volume rose 2.4% year over year, while rates declined for dry van equipment. Compared to March, both volume and rates slipped lower in April, a typical seasonal trend. For details, see the DAT Truckload Volume Index. |
|
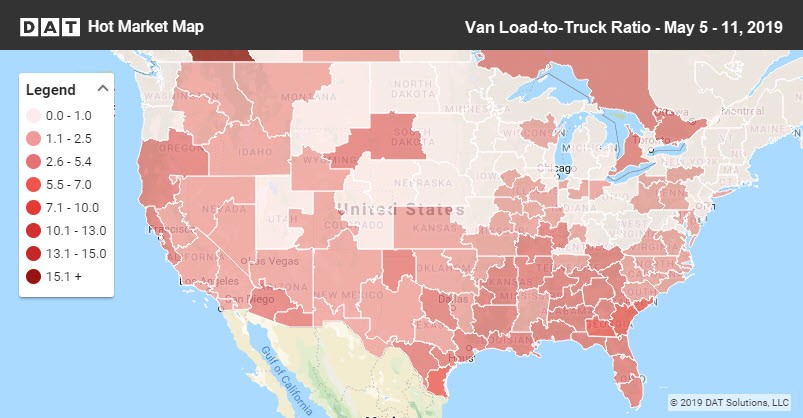
May 7-11: Rates slip lower, week over week Last week, demand continued to be strong in the Southeast region, which bodes well for the spring season – or what’s left of it – and key freight markets along the Mexican border saw heightened demand and intermittent equipment shortages. Traffic was also picking up out of California last week, but that trend may reverse now with the announcement of new tariffs and renewed uncertainty surrounding trade with China. Seasonal demand should eventually tap the remaining capacity during the month of June, when spot rates typically rise to a peak.
|
|
The national average load-to-truck ratio for vans has lingered at or below 2 loads per truck since January, due to ready availability of trucks. Load volume continues to increase gradually, however, compared to the same period in 2018. Last week, demand heated up in parts of the Southeast, in California, and in key markets along the border with Mexico, as seen in this DAT Hot Market Map. For more spot market freight trends, visit www.dat.com/trendlines. |
