USCC Compost Manufacturer’s Environmental Impact Analysis
 Back in March, the USCC initiated a Compost Manufacturer Member (CMM) survey requesting information on compost facility throughput. The purpose of this survey was to get a first-time estimate of our CMM’s impact on greenhouse gas avoidance, carbon sequestration and fertilizer value. CMM’s were quested to provide totals of feedstocks taken into their facilities and total tons or cubic yards of compost sold during calendar year 2020. All specific facility data was kept confidential and only the aggregated data was provided to perform the calculations. Of total number surveyed, only 25% of the CCM’s responded. So, the data reported below is at best a conservative representation of our Compost Manufacturer’s total environmental impact. The calculations were provided by Jane Gilbert of Carbon Clarity.
USCC Calculations

- Compost Manufacturer Members of the USCC sequestered an estimated 367,891 US tons (333,839 metric tonnes) in the study year 2020 of carbon dioxide equivalents (CO2-eq) in soil.
- This is equivalent to USD $20,531,104 in carbon dioxide value (assuming 1 tonne of CO2 is $ 61.50) based on World Bank estimates.
- 513,599 US tons of compost applied to agricultural land annually (10%) of the total.
1 High-Level Commission on Carbon Prices. 2017. Report of the High-Level Commission on Carbon Prices. Washington, DC: World Bank. License: Creative Commons Attribution CC BY 3.0 IGO
Assumptions & Notes:
- US tons converted to metric tonnes.
- 78% of compost applied directly to soil. Other markets disregarded in the calculations.

Tonnes of CO2 sequestered in soil:
- This is the amount of carbon in compost that is thought to be converted into long term soil organic carbon.
- The point of the exercise was to illustrate the value of compost when applied to soil.
- The total amount of organic carbon applied to soil will be much higher (possibly in the region of 3-4 times higher), but this will be less stable and will be used by the soil microbes as food.
- The calculations do not take into account avoided emissions from landfilling or burning.
- The calculations do not take into account processing or transportation emissions.
- This is not a life cycle assessment.
Sequestration rates:
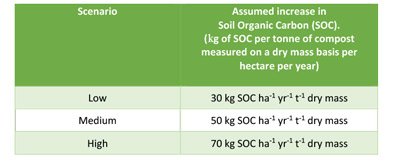
Assumed a 1:1:1 ratio of LOW:MEDIUM:HIGH sequestration rates, i.e., one-third of the country has a low sequestration rate, one-third a medium, and one-third high.

The rate and extent to which carbon is sequestered in soil is a function of several variables, such as soil type, prevailing climatic conditions, extent to which the soil is degraded, soil organic matter content, use of the land, type, and stability of the compost etc. This means that specific sequestration rates can vary within a single field. A "broad brush" approach has been taken assuming that there will be a low carbon sequestration rate in the southern third of the country; a medium rate in the middle third and a high rate in the northern third. Although this somewhat simplifies the situation, it provides a practical approach towards calculating benefit in the absence of more detailed data.
NUTRIENT CALCULATIONS

Value of nutrients

The tonnes of CO2-eq offset relate to the carbon footprint of nutrients in conventional fertilizers (i.e. the CO2 released during their manufacture). Care needs to be taken here, as these calculations do not take into account emissions in transporting and manufacturing compost, or the avoided emissions of not landfilling the organics.
The value of $97 million in nutrient value is impressive and may be set to rise as the cost of manufacturing inorganic fertilizers increases.
TOTAL VALUE

These figures show that our Compost Manufacturer Members provide significant positive impact in the US to both our environment and our economy. The Council will perform this survey on an annual basis going forward. We hope that CMM’s can now recognize the importance of aggregating their annual throughput for the betterment of the Composting Industry as a whole. We will keep you posted as we develop key infographics on this data for our members to use to spread the word on how composting closes the loop on the carbon and nutrient cycles.
Further information:
Background to these calculations can be found in the four reports published by the International Solid Waste Association (ISWA) in 2020. They formed part of ISWA’s Soils Project and can be downloaded from the website:
www.iswa.org/biological-treatment-of-waste

Jane Gilbert is a chartered environmentalist and waste management professional and has been involved in the organics recycling sector for over 20 years. She is a passionate about the role biological treatment technologies can play in the nascent circular economy, and how value can be extracted from biowastes. Jane offers consultancy, technical writing, editing, and training services, with a particular focus on the composting and anaerobic digestion sectors. She has extensive experience of working with industry, trade associations, professional bodies, and government, both within the UK and Europe.