Most people are familiar with Newton’s Law of Gravity. While sitting under a tree, an apple falls and hits him on the head. From there, the Theory of Gravity is proposed. But how many people know about the basic gravity in asphalt called the Theoretical Maximum Specific Gravity or Rice Value? The Rice Value for an asphalt mixture was not named after Snap, Crackle and Pop, but James Rice who developed the test procedure.
The theoretical maximum specific gravity (Rice Value) of the asphalt mixture is the mixture gravity without air voids present (i.e., one solid block). Thus, if all the air voids are eliminated from the asphalt sample, the combined specific gravity of the aggregates and asphalt binder would then be considered the theoretical maximum specific gravity (Gmm). The Gmm or Rice is considered the most consistent and repeatable test used to evaluate asphalt mixtures. The simplicity of this test and the repeatable accuracy makes it what some consider the most important test to evaluate an asphalt mixture. Why is the Rice value important? It is used to calculate the percent air voids in a compacted asphalt sample and the relationship between Rice and Asphalt Content (AC) is interdependent (as AC goes up Rice goes down and vice versa). Anytime there is a question about the measured AC content from an ignition oven or other methods, the Rice is referenced to provide confidence in the results.
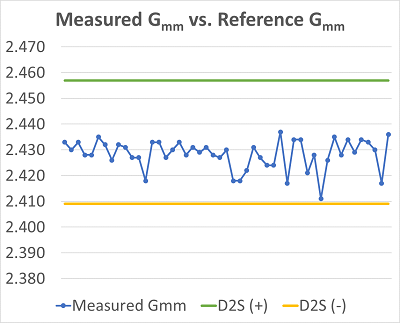
 For this round robin, all the samples were produced in one lab by the same technician to eliminate technician variability. During production of the samples, five(5) Rice samples were randomly tested for quality control. The average value of the tests where used to establish a target Rice value of 2.433. The five samples had a range of 2.430 to 2.435 with a standard deviation of 0.002. There were 49 samples submitted with this round robin. For analysis purposes, the VDOT D2S tolerance for the Rice Test of 0.024 was used. Each sample was compared to the reference Rice value of 2.433. To be acceptable, a result had to be between 2.409 – 2.457 (see Graph). This range is very wide and all results met this tolerance. However, the actual standard deviation for these lab produced samples was very tight – 0.0057 with an overall average of 2.428. The average of the five reference samples used to establish the target value and the average of the 49 samples was within one standard deviation of the 49 samples. Overall, very good reproducibility. However, several results from this test were confounding. The Rice Value was lower than the target, but the corresponding AC content was not higher than the average. These labs were contacted to check their Rice testing equipment and procedures.
While this analysis shows the overall consistency of the test by the participating technicians, this was material produced in the lab to exacting specifications. Even with the best quartering procedures during production, material sampled from the back of the truck will not be this repeatable. Further effort is required to properly assess the reproducibility of Rice values during production following acceptable sampling and quartering procedures.
In the January newsletter, the bulk specific gravity of the samples will be discussed. Also, if you did not participate and still want to or if you want to retest, it’s not too late. VAA still has a few samples available. Contact Mike Dudley at VAA.